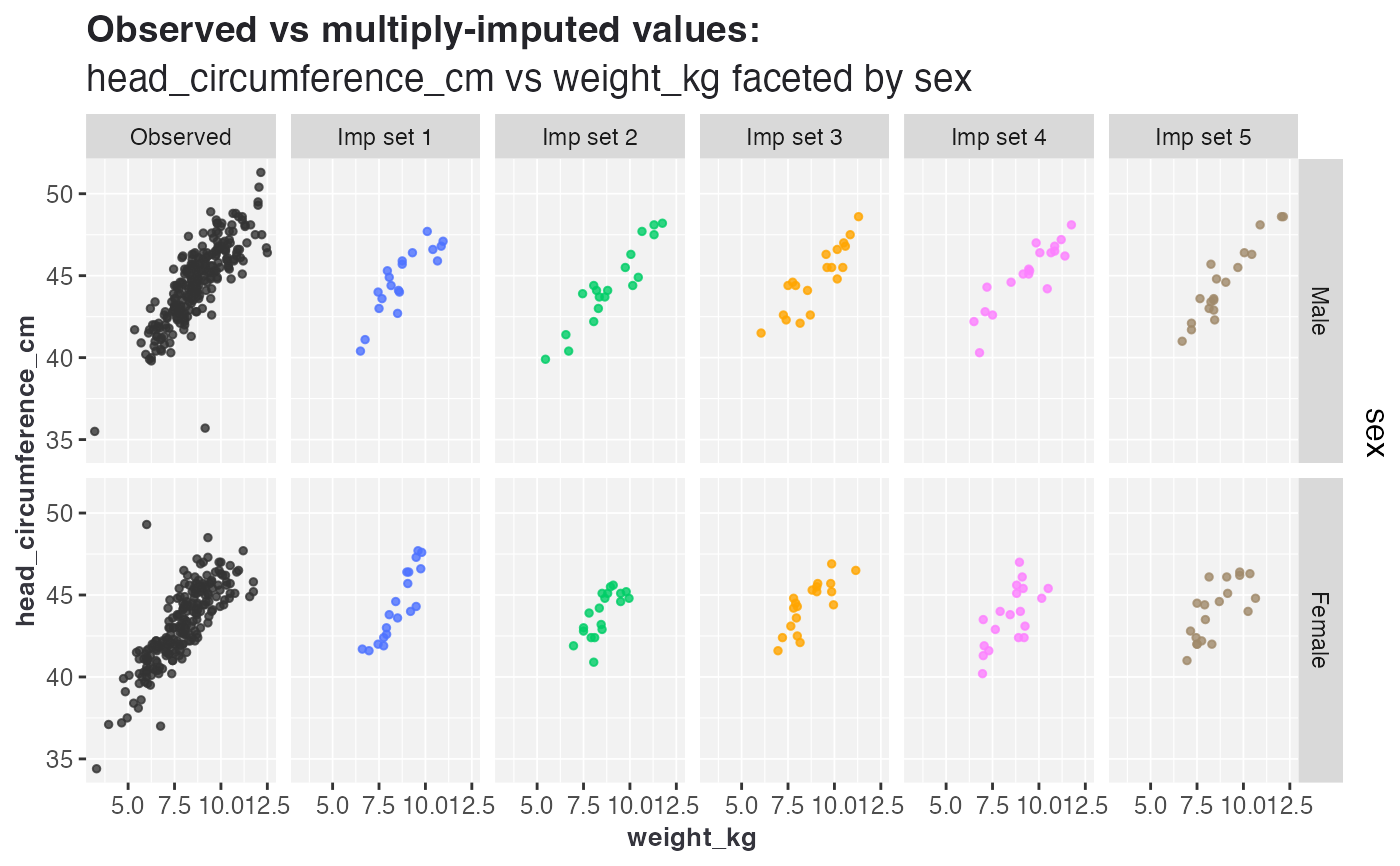
This function provides visual diagnostic tools for assessing multiply imputed datasets created with 'mixgb' or other imputers through inspecting the distributional characteristics of imputed variables. It supports 1D, 2D, and 3D visualisations for numeric and categorical variables using either interactive or static plots.
Usage
vismi(
  data,
  imp_list,
  x = NULL,
  y = NULL,
  z = NULL,
  m = NULL,
  imp_idx = NULL,
  interactive = FALSE,
  integerAsFactor = FALSE,
  title = "auto",
  subtitle = "auto",
  color_pal = NULL,
  marginal_x = "box+rug",
  marginal_y = NULL,
  verbose = FALSE,
  ...
)
Arguments
- data
A data frame containing the original data with missing values.
- imp_list
A list of imputed data frames.
- x
A character string specifying the name of the variable to plot on the x axis. Default is NULL.
- y
A character string specifying the name of the variable to plot on the y axis. Default is NULL.
- z
A character string specifying the name of the variable to plot on the z axis. Default is NULL.
- m
An integer specifying the number of imputed datasets used for visualisation. It should be smaller than
length(imp_list). Default is NULL (plot all).- imp_idx
A vector of integers specifying the indices of imputed datasets to plot. Default is NULL (plot all).
- interactive
A logical value indicating whether to create an interactive plotly plot (TRUE by default) or a static ggplot2 plot (FALSE).
- integerAsFactor
A logical value indicating whether to treat integer variables as factors (TRUE) or numeric (FALSE). Default is FALSE.
- title
A string specifying the title of the plot. Default is "auto" (automatic title based on
x,y,zinput). If NULL, no title is shown.- subtitle
A string specifying the subtitle of the plot. Default is "auto" (automatic subtitle based on
x,y,zinput). If NULL, no subtitle is shown.- color_pal
A named vector of colors for different imputation sets. If NULL (default), a default color palette is used.
- marginal_x
A character string specifying the type of marginal plot to add for the x variable in 2D plots. Options are "hist", "box", "rug", "box+rug"(default), or NULL when interactive = TRUE. Options are "box", "rug", "box+rug"(default), or NULL when interactive = FALSE.
- marginal_y
A character string specifying the type of marginal plot to add for the y variable in 2D plots. Options are "hist", "box", "rug", "box+rug", or NULL (default, no marginal plot) when interactive = TRUE. Options are "box", "rug", "box+rug", or NULL (default, no marginal plot) when interactive = FALSE.
- verbose
A logical value indicating whether to print extra information. Default is FALSE.
- ...
Additional arguments passed to the underlying plotting functions, such as point_size, alpha, nbins, width, and boxpoints.