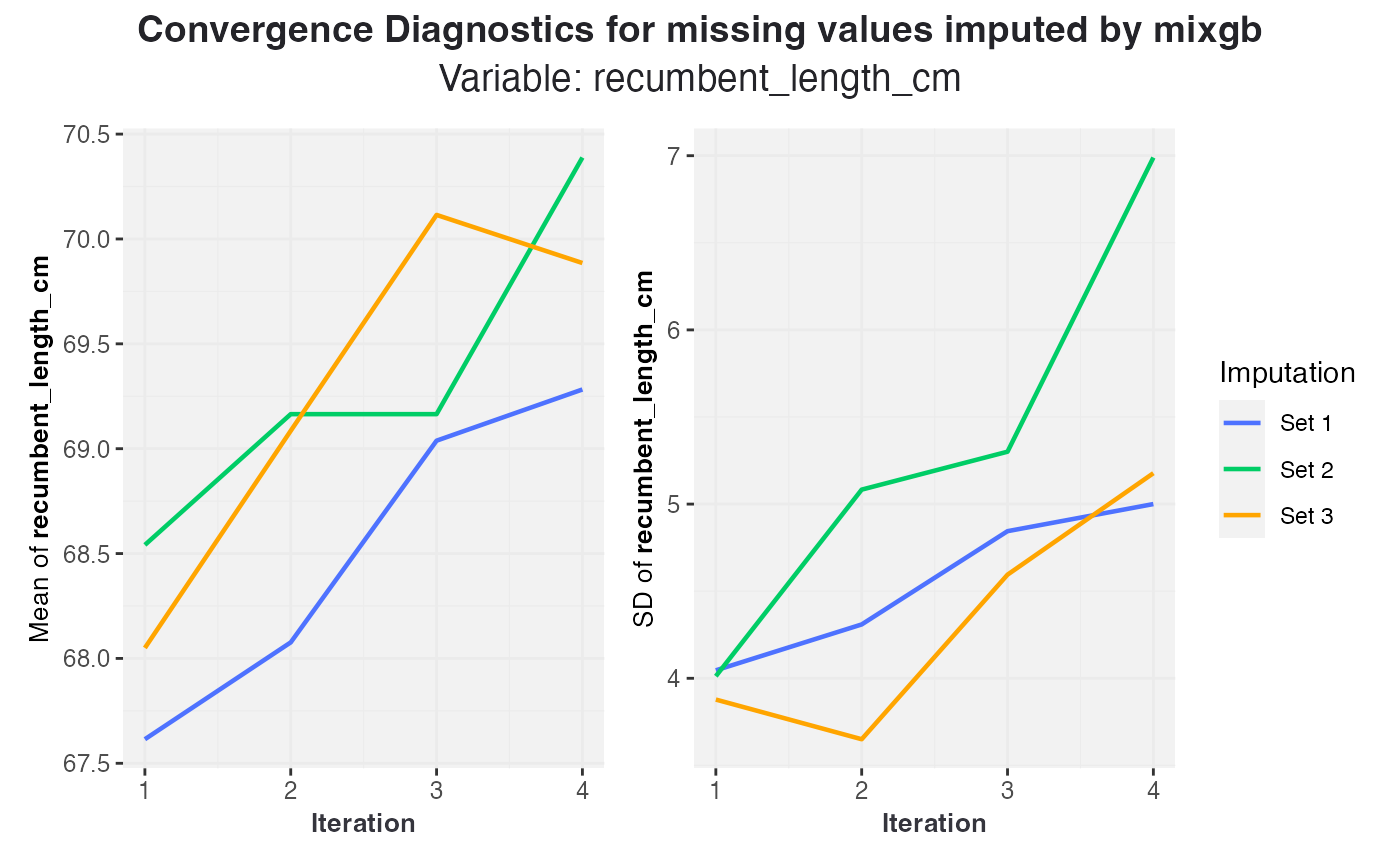
This function generates convergence diagnostic plots showing the mean and standard deviation (SD) of imputed values for a specified variable across iterations.
Usage
vismi_converge(
  obj,
  x,
  xlim = NULL,
  mean_lim = NULL,
  sd_lim = NULL,
  title = "auto",
  subtitle = "auto",
  tick_vals = NULL,
  color_pal = NULL,
  linewidth = 0.8,
  ...
)
Arguments
- obj
A 'mixgb' object returned by
mixgb()function or a 'mids' object returned by themice()function.- x
The name of the variable to plot convergence for.
- xlim
Optional numeric vector of length 2 specifying the x-axis limits for iterations.
- mean_lim
Optional numeric vector of length 2 specifying the y-axis limits for mean values of the variable.
- sd_lim
Optional numeric vector of length 2 specifying the y-axis limits for standard deviation values of the variable.
- title
A string specifying the title of the plot. If NULL, no title is shown. If "auto", a title will be generated based on the input. Default is "auto".
- subtitle
A string specifying the subtitle of the plot. If NULL, no subtitle is shown. If "auto", a title will be generated based on the input. Default is "auto".
- tick_vals
Optional numeric vector specifying x-axis tick values for iterations.
- color_pal
A vector of m color codes (e.g., hex codes). If NULL, default colors will be used.
- linewidth
The line width for the plot lines. Default is 0.8.
- ...
Additional arguments.