This function provides overimputation diagnostics for assessing imputations generated by 'mice', 'mixgb' or other imputers. It supports evaluation on both training and test data.
Usage
vismi_overimp(
  obj,
  x = NULL,
  y = NULL,
  z = NULL,
  m = NULL,
  imp_idx = NULL,
  integerAsFactor = FALSE,
  title = "auto",
  subtitle = "auto",
  num_plot = "cv",
  fac_plot = "cv",
  train_color_pal = NULL,
  test_color_pal = NULL,
  stack_y = FALSE,
  diag_color = NULL,
  seed = 2025,
  ...
)
Arguments
- obj
Overimputation object of class 'overimp' created by the
overimp()function.- x
A character string specifying the name of the variable to plot on the x axis. Default is NULL.
- y
A character string specifying the name of the variable to plot on the y axis. Default is NULL.
- z
A character string specifying the name of the variable to plot on the z axis. Default is NULL.
- m
A single positive integer specifying the number of imputed datasets to plot. It should be smaller than the total number of imputed datasets in the object.
- imp_idx
A vector of integers specifying the indices of imputed datasets to plot.
- integerAsFactor
A logical indicating whether integer variables should be treated as factors. Default is FALSE (treated as numeric).
- title
A string specifying the title of the plot. Default is "auto" (automatic title based on
x,y,zinput). If NULL, no title is shown.- subtitle
A string specifying the subtitle of the plot. Default is "auto" (automatic subtitle based on
x,y,zinput). If NULL, no subtitle is shown.- num_plot
A character string specifying the type of plot for numeric variables.
- fac_plot
A character string specifying the type of plot for categorical variables.
- train_color_pal
A vector of colors for the training data. If NULL, default colors will be used.
- test_color_pal
A vector of colors for the test data. If NULL, default colors will be used.
- stack_y
A logical indicating whether to stack y values in certain plots. Default is FALSE.
- diag_color
A character string specifying the color of the diagonal line in scatter plots. Default is NULL.
- seed
An integer specifying the random seed for reproducibility. Default is 2025.
- ...
Additional arguments to customize the plots, such as position, point_size, linewidth, alpha, xlim, ylim, boxpoints, width.
Value
An overimp_plot object displaying the overimputation plots for training and test data (if users set test_ratio > 0 in the overimp() function.)
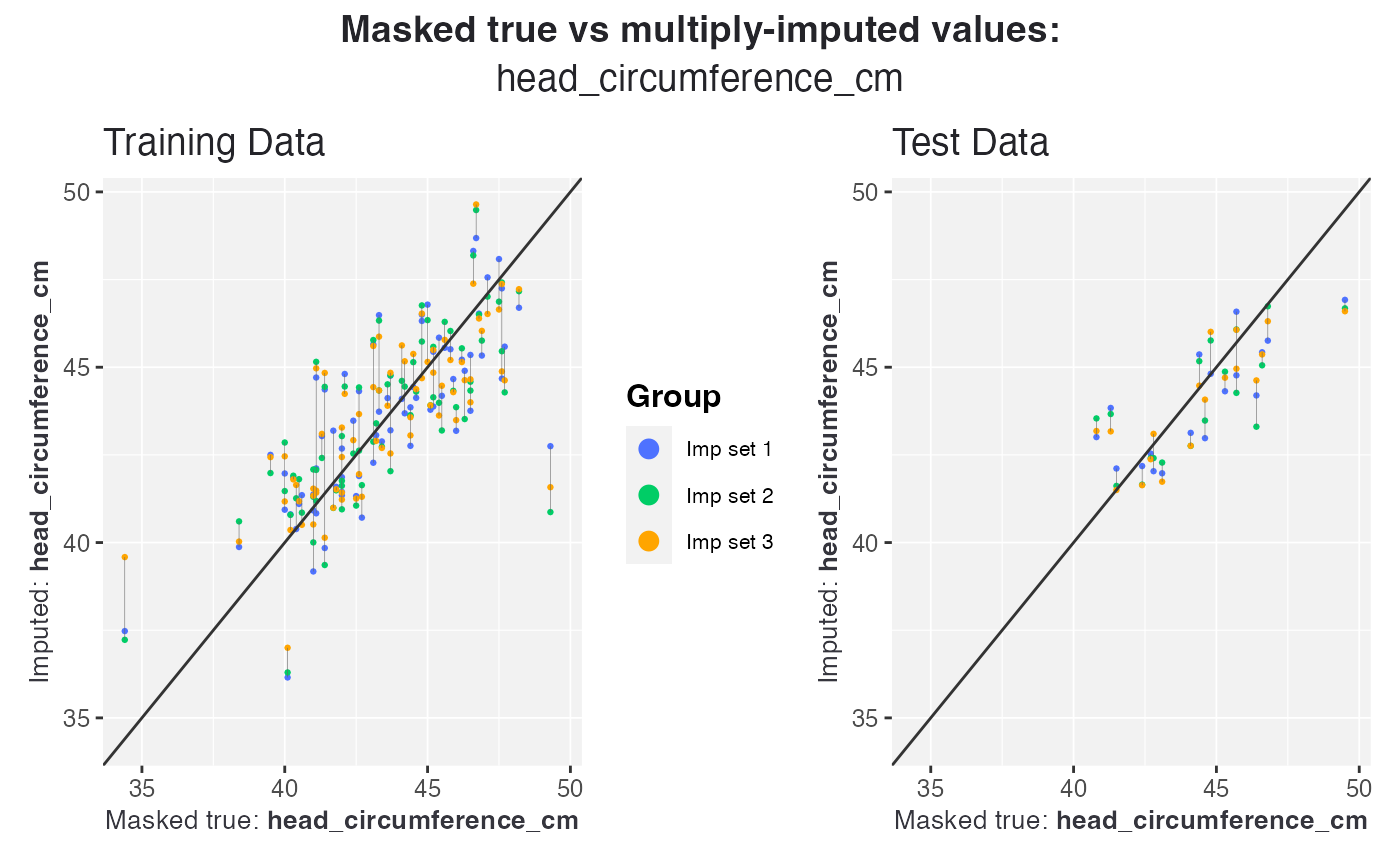
Examples
obj <- overimp(data = nhanes3, m = 3, p = 0.2, test_ratio = 0.2, method = "mixgb")
vismi_overimp(obj = obj, x = "head_circumference_cm", num_plot = "cv")